Lab 1
Topic: graphical data analysis/ visualization
EXERCISE 1.1 Continuous variable
Open the file with house prices in London in January 2019 (HP_LONDON_JAN19.xlsx), it can be downloaded from the course website.
- Explore the PRICE variable using histograms.
- Compare the distribution of the house prices for the different property types using boxplots.
EXERCISE 1.2 Categorical variable
This exercise uses the same data file as exercise 1
(HP_LONDON_19.xlsx).
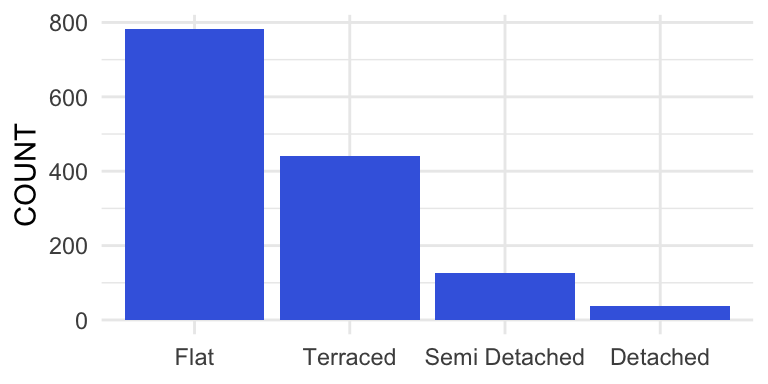
Use R to create the graphs in figure 1 en figure 2 below.
Figure 1
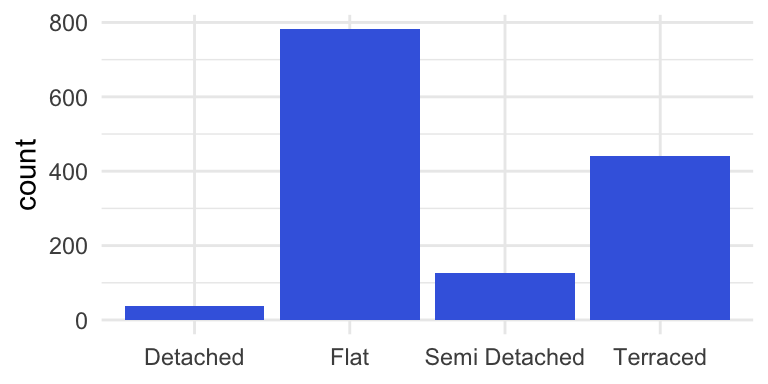
Figure 2
EXERCISE 1.3: categorical variable
This exercise uses the same data file as exercise 1
(HP_LONDON_19.xlsx).
Make a new variable ‘WEEKDAY’ (values: SUN, MON and so on).
- Create a barplot with the numbers of properties sold for each of the
weekdays in January 2019.
- Why is the graph created in part (i) misleading?
- Create a graph which gives a correct distribution of the numbers of properties sold on Sunday, Monday etc.
EXERCISE 1.4 Bivariate analysis: two categorical variables
Navigate to DUO website.
Choose: Databestanden/Hoger Onderwijs/Ingeschreven/hbo.
Dowload the file 01a.Ingeschrevenen
hbo 2019.xlsx.
- Create a table with number of male (GESLACHT == ‘man’) and female
students (GESLACHT == ‘vrouw’) per master program (use variable CROHO
ONDERDEEL) at Dutch Universities of Applied Sciences in 2021.
- Create barplots with number of male and female students per master program at Dutch Universities of Applied Sciences in 2021.
EXERCISE 1.5 Bivariate analysis: two numerical variables
The file RoomsForRentNeth.xlsx contains information about rooms for
rent in three big cities in The Netherlands, Amsterdam, Rotterdam and
The Hague.
The data is sampled from https://directwonen.nl/ on April 24, 2018.
- Generate a scatterplot with PRICE as Y-variable and AREA as X-variable.
- Is there a relationship between RENT and AREA for the rooms for rent in the three cities.
- Adjust the plot by mapping CITY on color. What stands out?